Let’s face it: fleets are underfunded. Hopefully I meet a fleet manager one day with enough budget to spend on whatever he or she desires.
But, the reality of my job is that my success is measured on how efficient my fleet operations are, not how much I spend or how many goodies I buy. Following this line of thought I implemented an LCO model to track vehicle replacement in my fleet. It’s worked out pretty well if you ask me.
Welcome Lowest Cost of Ownership - extending the lowest operating cycle of your asset. While a TCO formula tracks how much it costs to own an asset at any given point, LCO measures how long an asset can operate before facing an exponentially increasing CPM.
We can go into the math stuff in a later blog post. Let’s start with three easy steps on how to extend LCO cycles:
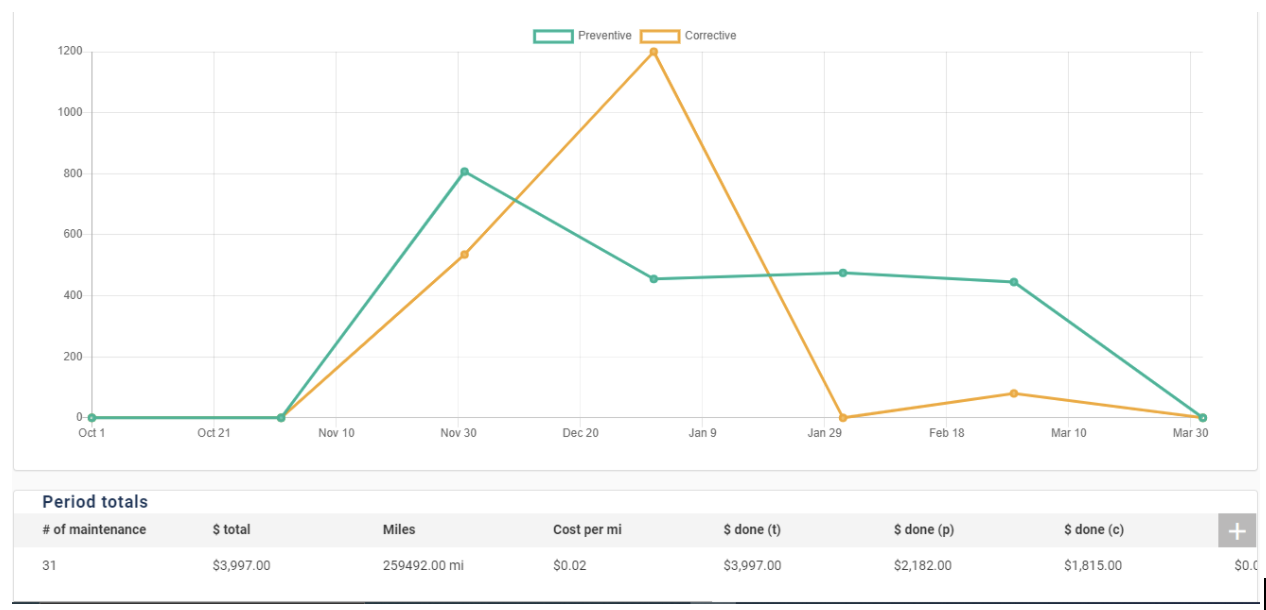
- Measure your Preventive Maintenance effectiveness: Most fleets have different types of vehicles to manage different business needs. Furthermore, when companies grow or scale back operations, the fleet usually expands or eliminates vehicles - as a result, fleet managers have to deal with different type of assets, from different models, makes, and age. However, many of us continue to perform standardized preventive maintenance schedules disregarding the fact that different vehicles have different needs. With the right technology you can start creating specialized preventive plans for each asset based on engine hours, mileage, and/or date. Then, you can track how the CPM and corrective costs ratios compare over time. This data will allow you to further optimize the PM schedules and as a result, extend the LCO cycle (because of lower corrective repairs and failures). Lots of info at the beginning to get this done, but then it’s easy cruising.
- Identify your most expensive vehicles: Tracking which vehicles have the highest increasing CPM rate allows you to anticipate likely part failures in the next 3 to 9 months. This allows you to make two separate decisions: create a specific inspection or PM for these vehicles to assess potential damage and/or decide which specific vehicles need replacement. Latest technology automates this entire process. Management likes these preventative measures because it eliminates any budget surprises.
- Driver maintenance costs: Use comprehensive reporting data to identify which drivers incur the highest amount of repair costs. While this is somewhat punctual, as any driver is prone to road accidents, it allows you to track whose driving behavior is increasing your LCO curve. For example, you can track across the latest quarter how many maintenance requests each driver caused - does this mean the driver needs better training? Perhaps the technicians need to do a better job? Or is it your suppliers that are not completing the work orders as you requested? Getting your driver input on maintenance is essential - work as a team and identify who is ultimately responsible and thus limit your LCO exposure.
While fleet fixed costs are easy to track, the LCO variables are incredibly hard to track given their ever-changing nature. Fixed projections no longer measure your fleet costs effectively. Spreadsheets and manual reporting are not fast enough to update these variables either. Get the latest tech and limit your LCO exposure - management will reward you for it.